How to Use the Microsoft Excel Visio Data Visualizer Add-In
Microsoft Visio Data Visualizer is a powerful data visualization tool that can help you visualize and analyze data in a variety of ways. With Microsoft Visio Data Visualizer, you can create custom data visualizations that can be used to understand complex data sets, or to simply communicate information in a more effective way. The best part is that Visio Data Visualizer is available to Microsoft 365 subscribers as an Excel Add-In.
In this article, I will walk through how to get started with Visio Data Visualizer and provide a brief example of how to use the tool.
Installing the Microsoft Visio Data Visualizer Excel Add-In
Depending on what version of Excel you are running, accessing the Visio Data Visualizer tool might be slightly different.
Pre-Installed Add-In
On the Excel ribbon, under the “Insert” tab, you will see a section “Add-ins”. If you are running a newer version of Excel, or are a Microsoft 365 Business subscriber, you might see the blue Visio icon (shown in the image below). Simply click on that and the visualizer tool will load.
Search for the Add-In
If you do not see the Visio icon in your Add-ins box on the Excel ribbon menu, you will need to select “Get Add-ins” where you will be able to search for “Visio Data” and the add-in will be able to add it to your Excel spreadsheet.
Different Types of Visualizations You Can Build in the Visio Data Visualizer Add-In
There are three main categories of visualizations you can create using the add-in. They are:
Basic Flowcharts
Cross-Functional Flowcharts
Organizational Charts
Within each of those different types of visualizations, you can decide on whether you want a horizontal or vertical layout for your chart.
How to Use the Microsoft Visio Data Visualizer Excel Add-In
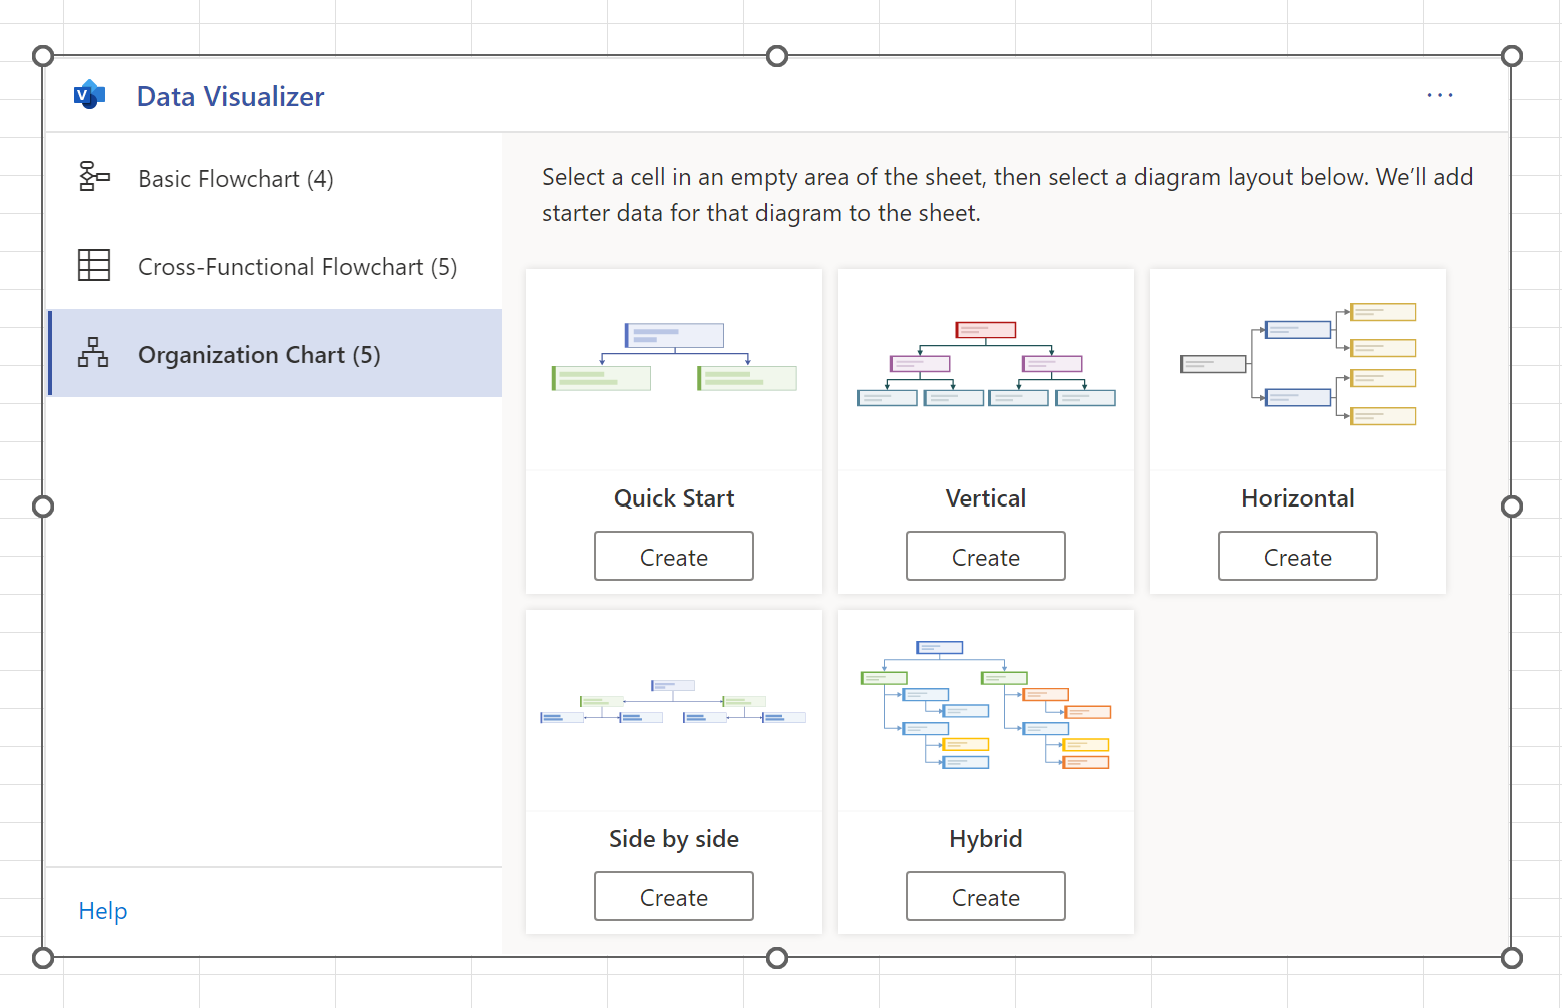
Using the Data Visualizer is easy. The best way to get started is to select a blank cell in your spreadsheet, select the add-in, pick which chart you want, and the Visio Data tool will create the data table to help get you up and running.
Organizational Chart Example
Let’s say you want to build an organizational chart in Visio, with the data from a Microsoft Excel worksheet.
In a blank spreadsheet, launch the Visio Data Visualizer Add-In. The Visio dialogue box will display, and select the Organization Chart option on the left and the chart orientation (horizontal, vertical, etc.).
After selecting those options, a data table and accompanying diagram will be displayed.
Now you are free to add to the data table as many rows as you want, following the format laid out in the sample data. Refresh the diagram anytime you want to see the visual representation of the organizational chart.
Excel Visio Data Visualizer Object and Microsoft Visio
Once your diagram is complete, you can move it around the Excel workbook anywhere you like, but the real power of the Visio Data Visualizer is that the diagram can live in your Visio instance. If your Microsoft 365 account comes with Visio, you can publish the Excel version of your diagram to your Visio account. Once it is in there, any changes you make, whether in Visio directly or in the data table, both sides refresh and stay up-to-date.
Final Thoughts on Visio Data Visualizer in Microsoft Excel
Microsoft Visio Data Visualizer is a great tool for data analysis and visualization within Excel, and can be used to create stunning visualizations that can help you gain insights into your data. However, you are limited on your customization options. Visio is still the best place if you want to produce in-depth, customizable diagrams, but this Excel Add-In is great for something quick and to give you a start if you need it.


