The BCG Matrix: A Guide to Strategic Portfolio Management
The BCG Matrix, also known as the Boston Consulting Group Matrix, is a strategic planning tool used by organizations to evaluate their portfolio of business units and determine which units should receive the most investment and attention. The matrix was developed by the Boston Consulting Group in the 1970s and is based on two key factors: market share and market growth rate.
The Four Categories of the BCG Matrix
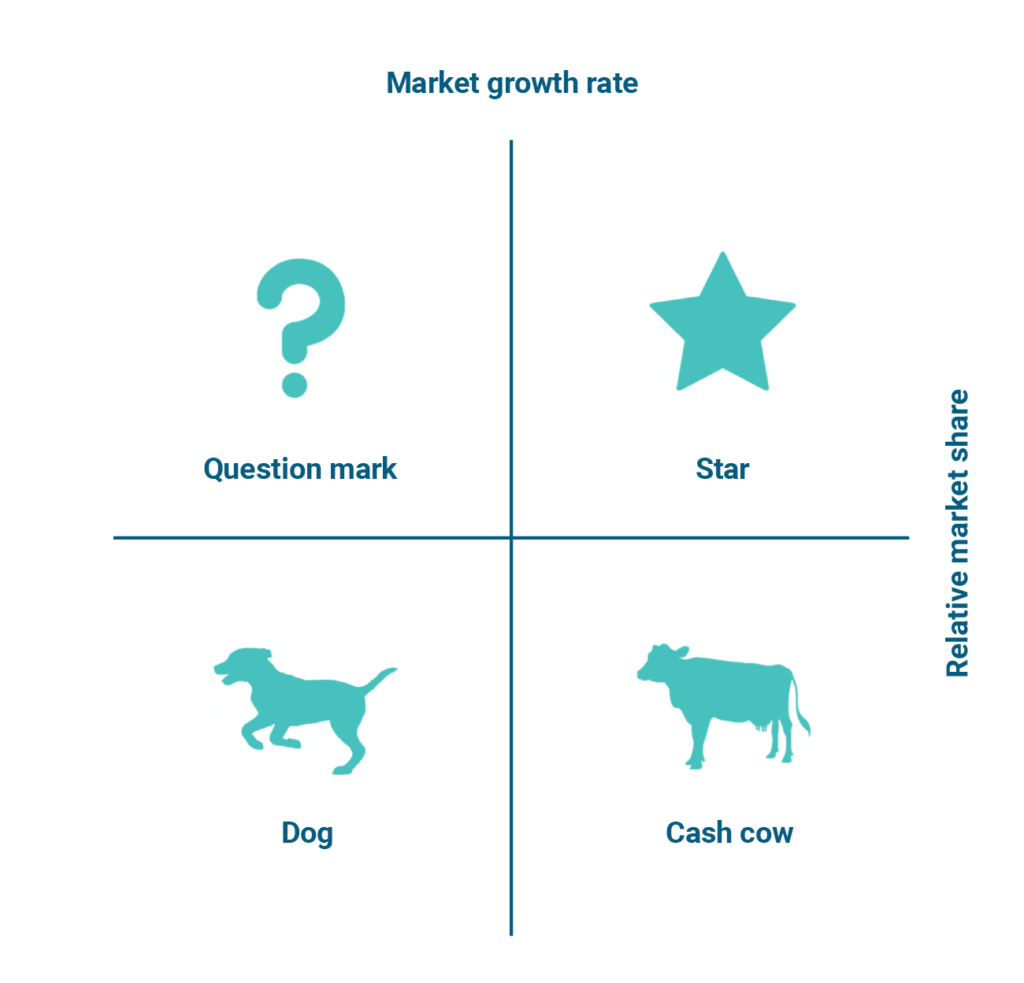
Market share is a measure of the organization's relative position in the market, while market growth rate represents the rate at which the market is growing. The BCG Matrix categorizes business units into four categories: stars, cash cows, dogs, and question marks.
Stars
Business units with a high market share in a high-growth market are considered stars. These units require significant investment to maintain their market position, but they also have the potential to generate substantial profits.
Cash Cows
Business units with a high market share in a low-growth market are considered cash cows. These units generate significant profits, but require little investment to maintain their market position.
Dogs
Business units with a low market share in a low-growth market are considered dogs. These units have limited potential for growth and generate little profit, if any.
Question Marks
Business units with a low market share in a high-growth market are considered question marks. These units require significant investment to increase their market share, but they have the potential to become stars if successful.
The BCG Matrix provides organizations with a framework to evaluate their portfolio of business units and to determine which units should receive the most investment and attention. For example, stars and question marks should receive significant investment to maintain or increase their market position, while cash cows should be managed for cash generation and dogs should be divested or phased out.
In conclusion, the BCG Matrix is a valuable tool for organizations looking to optimize their portfolio of business units. By evaluating market share and market growth rate, the matrix provides a framework for making informed decisions about investment and resource allocation, and can help organizations to achieve sustainable growth and profitability.